What if your machines could warn you before operations fail, production stops, or downtime starts costing thousands per hour? Let’s explore how businesses use IoT Monitoring Dashboards to track operations, monitor assets, and detect issues in real time.
The global landscape for connected devices expands at an unprecedented rate. By 2026, the global IoT market will reach $1.1 trillion, according to recent Statista reports. Businesses now manage thousands of connected devices across factories, warehouses, and supply chains. Without real-time visibility, operations become reactive instead of proactive. An IoT Monitoring Dashboard solves this challenge by converting live sensor data into actionable operational insights.
Recent data from McKinsey & Company suggests that real-time monitoring reduces maintenance costs by 30% and equipment downtime by 45%. Despite these benefits, many firms struggle to bridge the gap between raw sensor signals and business intelligence. A professional IoT analytics platform provides the technical infrastructure required to turn hardware signals into strategic growth.
Table of Contents
What Is an IoT Monitoring Dashboard?
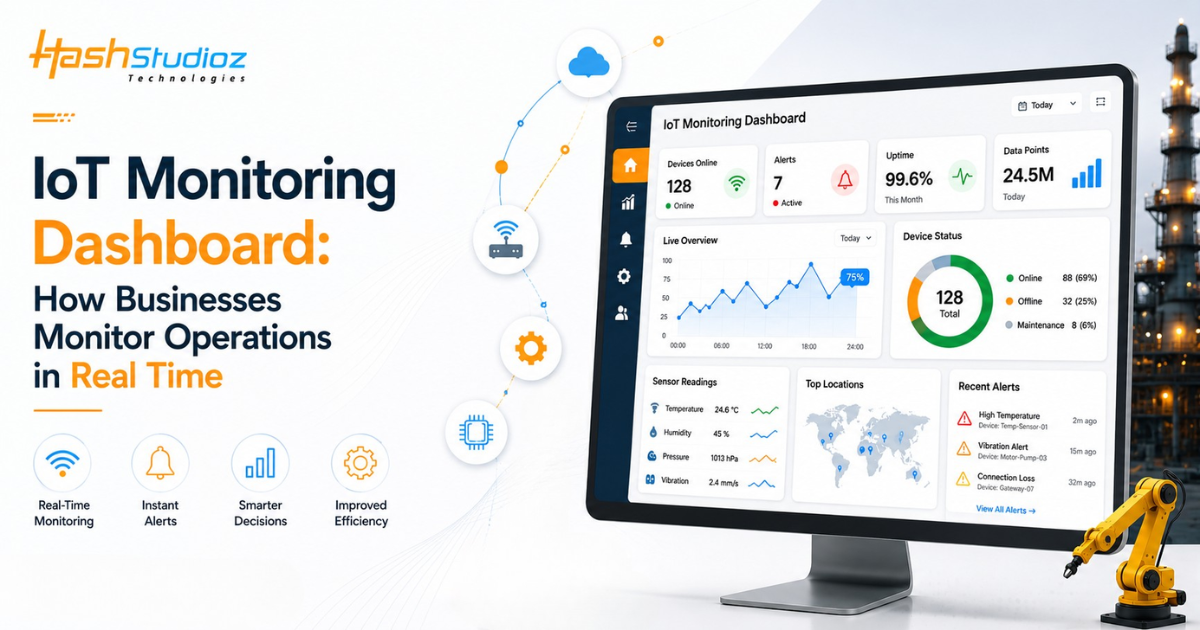
It is a real-time visualization system that collects, processes, and displays data from connected IoT devices. Businesses use these dashboards to monitor equipment health, track logistics operations, reduce unplanned downtime, and improve decision-making across complex industrial environments. This operational monitoring system acts as a central hub for all hardware telemetry.
The Technical Architecture of Smart Monitoring Systems
An industrial IoT dashboard serves as the frontend for a sophisticated data pipeline. To maintain high performance, the architecture must handle massive data velocity and variety.
1. Data Acquisition and Sensors
The process begins with hardware. Sensors measure physical properties such as temperature, pressure, or vibration. According to IDC, the volume of data generated by these sensors will exceed 79 zettabytes by the end of the decade.
2. Connectivity and Protocols
Data moves from the “edge” to the cloud. Technical teams select protocols based on the specific use case:
- MQTT (Message Queuing Telemetry Transport): The standard for real-time IoT monitoring due to its low bandwidth requirements.
- CoAP: This protocol serves restricted devices on the same local network.
- HTTP/HTTPS: Common for web-based IoT visualization tools and API integrations.
3. Data Processing and Time-Series Databases
Standard relational databases often fail under the weight of IoT data. Experts use time-series databases like InfluxDB or AWS Timestream. These systems prioritize data points indexed by time. This allows a real-time IoT analytics engine to render charts instantly without lag.
Expert Insight on IoT Dashboard Implementation
Many businesses fail with IoT dashboard projects because they focus only on visualization. Poor sensor calibration, inconsistent data quality, and weak network planning often reduce analytics accuracy. Technical teams should first build a reliable data infrastructure before scaling real-time IoT monitoring systems.
IoT Dashboards vs. Traditional Monitoring Systems
Many businesses still rely on legacy Supervisory Control and Data Acquisition (SCADA) systems. While reliable, these systems lack the flexibility of a modern real-time monitoring platform.
| Feature | Traditional SCADA | Modern IoT Monitoring Dashboard |
| Accessibility | Limited to local control rooms | Accessible globally via web and mobile |
| Scalability | High cost to add new nodes | Highly scalable via cloud infrastructure |
| Data Silos | Data is often isolated | Integrates easily with ERP and CRM |
| AI Integration | Very limited | Supports advanced predictive analytics |
| Updates | Requires manual intervention | Continuous delivery and cloud updates |
7 Key Features Businesses Should Look For
When selecting the best IoT dashboard software, technical leaders must prioritize features that support long-term scalability and security.
- Customizable Widgets: These allow users to create specific views for different roles.
- Low-Latency Refresh: This ensures that the view reflects current conditions within milliseconds.
- Historical Playback: Users analyze data from the past to identify slow-moving trends.
- Cross-Platform Compatibility: Accessing operational monitoring dashboards on desktops or smartphones.
- Sophisticated Alerting: Setting complex triggers that go beyond simple thresholds.
- Multi-Tenant Support: Managing different sites within a single enterprise IoT visualization system.
- End-to-End Encryption: Protecting data from the sensor to the final display.
How to Choose the Right IoT Monitoring Dashboard
Selecting the wrong platform leads to technical debt. Follow these steps to evaluate your options:
1. Define Your Data Velocity
How often do your sensors report data? A slow-moving shipping container needs fewer updates than a high-speed turbine. Ensure your cloud IoT monitoring tools can handle your specific ingestion rates.
2. Evaluate Integration Capabilities
A dashboard should not be an island. It must connect with your Cloud Integration Services and IoT Development Services. Ensure the platform provides a robust API for bi-directional data flow.
3. Check for Edge Computing Support
In some cases, you should process data locally before sending it to the cloud. This reduces costs and improves speed. Look for a smart factory dashboard that supports edge-based filtering.
Build vs Buy IoT Dashboard Solutions
Businesses can purchase ready-made IoT dashboard software for faster deployment. Custom-built platforms provide greater flexibility, integration control, and industry-specific features. The right approach depends on scalability, security, and operational requirements.
Common Challenges in IoT Dashboard Deployment
Businesses may face several technical challenges during IoT dashboard implementation. Common issues include sensor calibration errors, network latency, API integration complexity, cybersecurity risks, and large-scale data processing limitations.
Inconsistent device communication and poor data quality can also reduce real-time monitoring accuracy. Without proper architecture planning, these issues may affect operational visibility and analytics performance.
Benefits of Real-Time Operational Monitoring
Real-time monitoring helps manufacturers track production activities continuously across machines. The following benefits explain how these systems improve efficiency and visibility.
1. Predictive Maintenance for Industrial Assets
Moving from reactive to predictive maintenance is the biggest driver of ROI. Industrial IoT dashboards detect microscopic changes in machine vibration. These indicators often appear weeks before a mechanical failure. By scheduling repairs early, companies avoid the “domino effect” of shutdowns.
2. Energy Management and Sustainability
According to Gartner, sustainability is now a top 10 priority for CEOs. IoT sensors track energy consumption across different lines. Smart monitoring systems highlight inefficiencies, such as machines running idle. This visibility helps firms meet environmental goals and reduce costs.
3. Remote Fleet and Logistics Management
For logistics firms, IoT visualization tools provide a live map of the entire fleet. Managers monitor fuel levels, tire pressure, and cargo temperature. This ensures that perishable goods remain safe and drivers follow the best routes.
Use Case: Healthcare Patient Monitoring
Modern hospitals use an IoT Monitoring Dashboard to track patient vitals across wards.
- Technical Setup: Wearable sensors transmit heart rate via Bluetooth to a local gateway.
- Real-Time Action: The dashboard alerts the nursing station immediately if vitals drop.
- Internal Integration: This system often connects with specialized IoT App Development projects for clinical workflows.
Security Architecture for IoT Platforms
Security is a primary concern for operational monitoring dashboards. Technical teams must implement a “Zero Trust” architecture to protect assets.
- X.509 Certificates: Each device gets a unique digital identity.
- Network Segmentation: Keep the IoT network separate from the corporate network.
- OTA (Over-the-Air) Updates: Patch security holes in sensors remotely.
- Data Masking: Hiding sensitive information on public-facing screens.
The Role of Machine Learning in IoT Analytics
In 2026, the best IoT analytics platforms predict what will happen next. Machine learning models analyze years of data to find hidden patterns.
- Anomaly Detection: The system learns “normal” behavior and flags unusual activity.
- Demand Forecasting: Predicting how much material a factory needs based on production.
- Automated Optimization: The dashboard sends commands back to the hardware to adjust settings.
This transition from descriptive to prescriptive analytics defines modern Industrial IoT Solutions.
Integrating IoT Dashboards With Business Systems
To maximize your dashboard, link it to other core business functions:
- Connect to Predictive Maintenance Solutions to automate work orders.
- Align with IoT Development Services to build widgets for specific KPIs.
- Integrate with Cloud Integration Services to back up historical data safely.
Future Trends in IoT Monitoring Dashboards
As technology evolves, the following trends will redefine how businesses interact with their industrial IoT monitoring platform:
- From Predictive to “Agentic” AI: In 2026, dashboards are moving beyond predicting failures. “Agentic AI” allows the IoT analytics platform to not only sense an issue but also execute a solution in the physical world. Such as automatically adjusting a valve or rerouting a delivery drone without human intervention.
- Immersive Dashboards via AR/VR: Traditional 2D screens are giving way to enterprise IoT visualization in 3D. Using Augmented Reality (AR) glasses, technicians can overlay live performance data directly onto the physical machine they are repairing, creating a “Digital Twin” experience in real time.
- 5G-Advanced and 6G Sensing: The rollout of 5G-Advanced and early 6G research is introducing “Integrated Sensing and Communication.” This allows the network itself to act as a sensor, providing real-time IoT analytics on movement and environment, even for devices without dedicated hardware sensors.
- Energy Harvesting for “Zero-Power” IoT: Future cloud IoT monitoring tools will track thousands of tiny, battery-less sensors. These devices harvest energy from light, heat, or radio waves, allowing for massive-scale monitoring of assets like individual pallets or structural beams without maintenance cycles.
- Natural Language Querying: Instead of building complex filters, managers will use “Conversational BI.” You will simply ask your smart factory monitoring dashboard, “Why did line three slow down this morning?” and receive a root-cause analysis with an automatically generated chart.
These advancements ensure that the IoT Monitoring Dashboard remains the most critical tool for business resilience. By staying ahead of these trends, companies can build a smarter, more autonomous, and highly efficient operational future.
Conclusion
Businesses investing in modern IoT Monitoring Dashboard solutions gain faster visibility and stronger operational control. Converting raw sensor data into a clean, visual format is now a technical requirement for industry.
With the right architecture, companies build scalable systems that support long-term digital transformation. By focusing on real-time IoT monitoring and leveraging a professional IoT analytics platform, your organization moves from reactive troubleshooting to proactive excellence. If you are ready to scale, consider how professional IoT Development Services can tailor these tools to your needs.
FAQs
1. What is the difference between SCADA and IoT Monitoring Dashboards?
SCADA systems mainly support local industrial control environments, while IoT Monitoring Dashboards provide cloud-based monitoring, remote accessibility, advanced analytics, and AI-driven insights.
2. How do IoT dashboards improve operational efficiency?
IoT dashboards improve operational efficiency through real-time monitoring, predictive maintenance, automated alerts, and faster decision-making. They help businesses reduce downtime and improve equipment performance.
3. Which industries use IoT monitoring dashboards?
Manufacturing, logistics, healthcare, energy, retail, and smart city projects commonly use industrial IoT dashboards. These industries rely on real-time visibility for operational control and asset monitoring.
4. What technologies are used in IoT monitoring systems?
IoT monitoring systems use technologies such as sensors, MQTT protocols, cloud computing, edge computing, AI analytics, and time-series databases. These technologies support real-time data processing and monitoring.
5. Why is real-time monitoring important in IoT systems?
Real-time monitoring helps businesses detect equipment failures, operational anomalies, and performance issues immediately. This improves maintenance planning, operational visibility, and production continuity.