
The present scenario is of the mobile world, and companies know how to take advantage of this golden opportunity. In the past years, from the memorable snake game on Nokia 6110 to the first 500 apps in the Apple app store (debuted in July 2008), mobile apps have grown tremendously.
As you well know, how vital the Key metrics of Mobile Apps are for your growing business, you cannot miss the power metrics of your business app.
According to a study
- The average mobile app loses 77% of its users within 3 days of download. This means that it’s essential to track your app’s early engagement metrics to see if it’s resonating with users.
- The average mobile app user spends only 26 minutes per day in an app. This means that you need to make sure your app is engaging and useful enough to keep users coming back for more.
- The average conversion rate for mobile apps is 1%. This means that you need to track your app’s conversion metrics to see how well it’s converting users into paying customers.
All the crucial analytics metrics mentioned in the blog help you understand how users interact with your app and why? Apart from that, you also get to know whether your app is making money or not. And ultimately encourage you to take the right action in terms of reaching the business goals.
Table of Contents
11 Key Metrics for the Mobile app you cannot miss
Even if you may have logged in to check the analytics, the confusion of more is always there. Being new in the app market, it is common to get overwhelmed with so much data out there. From daily active users to monthly active users to return on investment everything seems to be important.
Don’t worry!!
We are here to narrow down the things for you so that you can focus on what matters for you. Hence, buckle up to cover the three key segments of mobile app metrics mentioned below:
- Usage and engagement metrics
- Profitability metrics
- The golden metrics
Interesting fact: 25% of downloaded mobile apps, only get used once.
Usage and Engagement Key Metrics of Mobile App
Competition on mobile apps is tight. You can not just create the app and relax. You need to know how users are interacting with your app. The performance of certain pages that you think are the pillars of the app.
At the same time, it is essential to track the elements that keep users continuing and exploring further. And with tools like Google Analytics, Localytics, Kissmetrics, Flurry, or Mixpanel you can easily track usage and engagement Key metrics of Mobile App
Here, we will explain the key usage and engagement metrics that you must check for app performance.
1. Downloads and Install
It’s important to measure the number of installs on your app. Hence a developer must track these basic metrics. No download means no users, and no users mean no profit. Although this metric alone will not help you understand the performance of your app, as there may be some downloads because of the marketing campaign.
What if people install your app and never used it again or uninstalled it right away?
Whatever the case, it still creates the base for all other metrics you use.
Steps to Track App Downloads and Install
Setting up an app install tracking code is easy. If you are using Google Analytics, then you may go through this step-by-step process to track the app downloads and install them on your app.
2. App Acquisition
Now, once you know how many app downloads have already taken place, you need to know from which sources these downloads happened.
And this metric serves the purpose for you. It will let you know the effectiveness of your marketing campaigns and help in figuring out which channel works best for you. So that you can make the most of your pennies spent on marketing.
For example, if you are running multiple marketing campaigns on various channels. This app acquisition metric will help you understand the effectiveness of a particular campaign. So that you can further pause it or spend more on the same depending on the result.
How to Track App Acquisition
The tracking of App acquisition metrics is easy. Either you can track one of the most widely used platforms Google Analytics or use the business analytics platform Mixpanel.
While using Mixpanel, you will see different sources of campaigns with different colors and their impact in a graph representation. The rise of Facebook ads in comparison to Twitter ads will help you in understanding that spending more on Facebook will bring results rather than equal distribution.
3. Active Users
As we already know, not all the people who download our app are active users. Hence to know the usefulness & interactive ability of the app we need to track the Active users of the app.
Active users open and engage with your app regularly. This makes it the real metric to gauge your app performance.
According to Google Analytics, the real-time user is one who is currently using your app, while active users are those who have opened & interacted with your app within the last 30 days.
Active users can further be categorized into Daily active users and monthly active users.
While DAU measures the number of users who have at least one session with your app daily, MAU measures the number of users who have at least one session in a month.
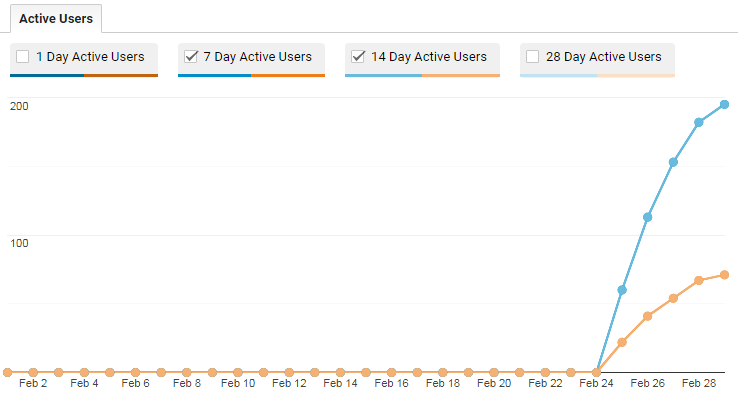
How to Track Active App Users
Most analytics tools facilitate this metric. And if you are using Google Analytics, Under the audience menu you will see the ‘Active users’ option.
then this is how it displays active mobile app users
4. Average Daily Sessions per Daily active users
This is again an essential metric to assess our business progress. This metric shows how many times on average users open and interact with your app daily.
Now, if you are wondering, what should be an ideal number of average daily sessions per daily active user? Then let me tell you that It depends on your business type.
Social media apps like Facebook, Twitter, LinkedIn, and Instagram want their users to have a higher number of daily sessions on average. While other apps that don’t need to be used as much to be successful may be happy with a lower number.
How to track Average daily sessions per DAU
Average Daily Sessions = Number of Daily Sessions / Number of Daily active users
5. Touch Heatmaps
The touch heatmaps metric provides insights into the areas of the app screen that users interact with the most. This way you will be able to know which features are engaging most of the users and which elements got missed.
So that further, you can make strategies to grab their most attention and overcome the lagging features. You can also analyze the time spent on a particular task. That will further help you in understanding whether a particular segment is difficult or confusing for users. It may also reflect if something is engaging, easy, and fun.
How to Track Touch Heatmap Metric
There are various online tools available that facilitate touch heatmap metrics to be tracked
Appsee Mobile Analytics Is one of the most commonly used tools to track touch heat maps for iOS and Android apps.
6. Retention Rate
The app retention rate metric will let you know how many users return to your app next time. In a nutshell, retention rate measures the number of users your app can retain after a certain period.
In today’s scenario competition is very high, and people get bored easily. And retaining app users over a period is a challenge that all app owners have to tackle efficiently to succeed.
This metric also becomes useful while implementing new features or releasing a new update. You will know whether the particular new updates or features will be able to keep users engaged or drive them away.
How to Track Retention Rate
App Retention Rate % = (Number of users retained at the end of Time Period / Total users at Start of Time Period ) x 100
7. Churn Rate
App churn rate is a metric that calculates the number of users who leave a product/page over some time, divided by the total remaining users.
It’s just the opposite of the retention rate. Simply put, It let you know how many users stopped using your app after some time.
How to Track Churn Rate
1 — Retention Rate = Churn Rate
Profitability Metrics
8. Cost per Acquisition
Cost per acquisition metrics measures the aggregate cost of a customer taking the action that leads to conversion. The conversion could be a sale, a click, a form submission, or other forms.
Also referred to as CPA, it is a vital metric for marketing success.
Though you may be happy by watching the number of downloads or conversions to tell how well your app is performing. But you need to know the costs to acquire new users as well.
How to Track Cost per Acquisition
Cost Per Acquisition = Total Cost of Campaign / Total Conversions
9. Return on Investment
ROI is a business-performance metric, that is used to evaluate the efficiency of the investment done in the app business. In a nutshell, it calculates the money you make on the money you spend building and marketing the app.
How to Track Return on Investment
Return on Investment ( % ) = (Gain From investment — Cost of Investment ) / Cost of Investment) x 100
10. Lifetime value
Lifetime value(LTV) also referred to as customer lifetime value(CLTV) estimates the profit coming from any given customer. This metric is tracked to assess the financial value of a typical customer.
Marketers make sure that the LTV should be always greater than the CPA.
How to Track Lifetime Value (LTV)
App Lifetime Value = Average Value of Conversion x Average Number of Conversions x Average Customer Lifetime
11. The Golden Metric
This is one of the most important metrics to track for a mobile app. It could also be taken as the rating metric.
As an app owner, your focus should be always on increasing mobile app reviews. Because users nowadays do their research before interacting with your app.
Hence, no matter how much you focus on other metrics, if you have a poorly rated app on Google Play or the app store, potential users will always be a step away.
Sure, here is a unique blog conclusion including the keyword “app development company”:
Conclusion
The mobile app market is a crowded one, and it can be difficult to stand out from the competition. However, by tracking the right metrics, you can gain valuable insights into how your app is performing and make necessary adjustments to improve its success.
The 11 key metrics outlined in this blog post are a good starting point, but you may need to track additional metrics depending on your specific app and goals.
FAQs
Q: What are the most important mobile app metrics to track?
A: The most important mobile app metrics to track will vary depending on your specific app and goals. However, some of the most important metrics to track include:
- Downloads: This metric tracks the number of times your app has been downloaded.
- Active users: This metric tracks the number of users who have opened your app in the past 30 days.
- Sessions: This metric tracks the number of times users have opened your app and started using it.
- Average session length: This metric tracks the average amount of time users spend in your app each time they open it.
- Retention rate: This metric tracks the percentage of users who continue to use your app after they
Q: How do I track mobile app metrics?
A: There are a number of ways to track mobile app metrics. You can use a mobile app analytics platform, such as Google Analytics for Firebase or App Annie. You can also use the built-in analytics tools that are available on most mobile app development platforms.
Q: What do I do with the data I collect from tracking mobile app metrics?
A: The data you collect from tracking mobile app metrics can be used to improve your app. You can use the data to identify areas where your app is performing well and areas where it could be improved. You can also use the data to make changes to your app’s marketing and promotion strategies.
Q: How often should I track mobile app metrics?
A: The frequency with which you track mobile app metrics will depend on your specific app and goals. However, it is a good idea to track your metrics at least once a month. This will allow you to monitor your app’s performance and make necessary adjustments as needed.