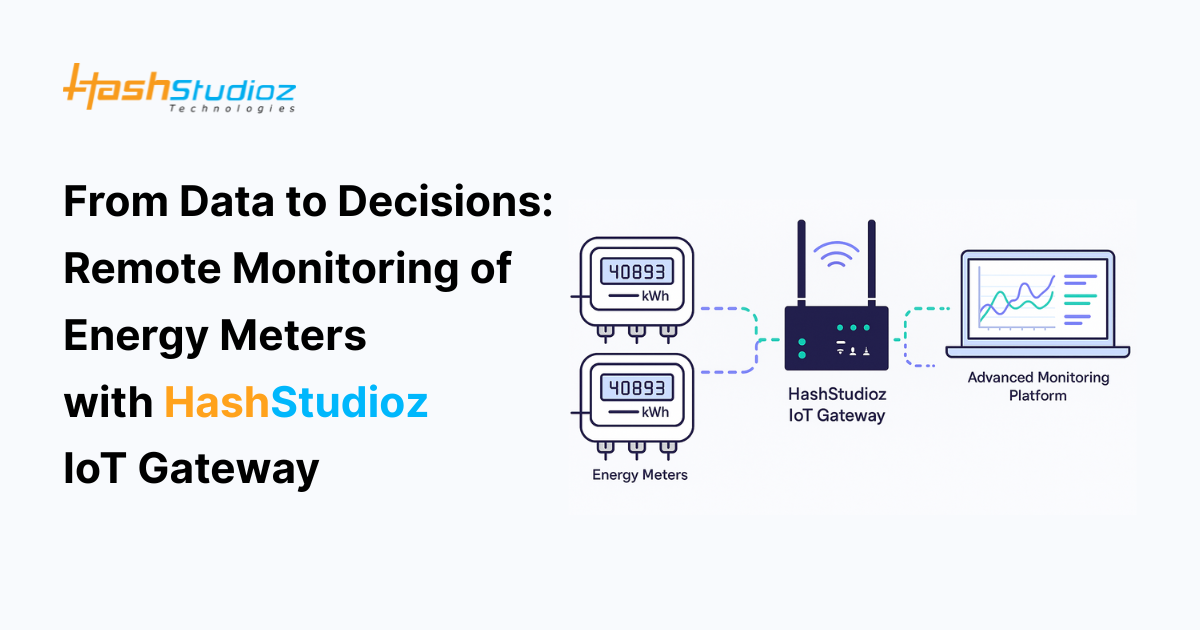
Remote monitoring of energy meters has become a cornerstone in modern energy asset management. With the increasing demand for efficient energy use and cost reduction, industries and facilities now leverage IoT solutions to keep track of energy consumption in real time. This article details how HashStudioz Technologies IoT gateways enable remote monitoring of energy meters in a beginner-friendly manner. Our discussion will cover the essential hardware components, system architecture, implementation steps, benefits, troubleshooting tips, and insights into future trends.
The importance of energy meter monitoring is underscored by the shift towards smart grids and sustainable energy management systems. Effective monitoring provides valuable insights into fluctuating energy parameters, which in turn leads to predictive maintenance, improved efficiency, and ultimately, significant cost savings.
Table of Contents
Core Components
Remote energy monitoring relies on a mix of hardware devices and supporting technologies. Here, we break down the critical components and explain their roles.
1. Recommended Hardware Configuration
The following table presents a typical configuration setup for remote energy monitoring using HashStudioz IoT gateways:
| Component | Model / Example | Purpose |
|---|---|---|
| IoT Gateway | HSZ-RS485-GW | Converts protocols (Modbus/RS-485) and transmits data |
| Energy Meter | Generic Modbus-compatible energy meter | Measures energy consumption and other metrics |
| Power Supply | 12V DC Industrial Power Supply Unit | Provides regulated power to IoT devices |
| SIM Card | 4G LTE Data Plan | Enables reliable cellular data connectivity |
| Additional Sensors | Optional sensors for temperature, current, or voltage (e.g., ACS758, DS18B20) | Enhances data collection if monitoring environmental conditions |
2. Detailed Hardware Overview
- IoT Gateway (HashStudioz Models):
HashStudioz offers several IoT gateway models designed to work in industrial environments. Their RS-485 IoT Gateway converts the incoming Modbus data from energy meters and relays it using secure protocols over 4G/LTE networks. This gateway acts as a translator between legacy industrial systems and modern cloud-based applications, ensuring uninterrupted connectivity and real-time monitoring. - Energy Meter:
The energy meter is generally a Modbus-compatible device that records energy consumption, voltage, current, and power factor. Although various models exist, many are designed with compatibility in mind to work seamlessly with IoT gateways. This meter’s data is critical for monitoring energy trends and identifying inefficiencies. - Supportive Components:
Power supplies and SIM cards play supporting but crucial roles. A reliable industrial power supply ensures that the gateway functions continuously even in challenging conditions. Similarly, a dedicated SIM card with a robust 4G LTE plan guarantees that data is transmitted reliably to the cloud, irrespective of the physical location.
3. Visualization of the Hardware Layout
Below is an illustrative image showcasing the approximate layout of the installation, including the energy meter, IoT gateway, and connectivity modules:
In addition, a simplified circuit diagram outlining the connections between an energy meter and a HashStudioz IoT gateway is provided later in the article.
System Architecture
A clear understanding of the system architecture is essential for both implementation and troubleshooting. In remote monitoring systems, data flow must be secure, reliable, and timely.
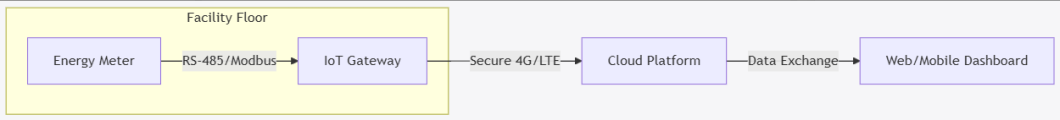
1. Overview of the Connection Flow
The architecture of a remote monitoring system can be broadly divided into three segments: the field devices (energy meters and sensors), the IoT gateway, and the cloud platform that processes and visualizes data.
Facility FloorRS-485/ModbusSecure 4G/LTEData ExchangeEnergy MeterIoT GatewayCloud PlatformWeb/Mobile Dashboard
2. Detailed Data Flow Process
The data processing workflow in a typical remote monitoring system involves the following stages:
- Data Collection:
The energy meter continuously or periodically measures and records energy parameters (voltage, current, power) and sends these readings over an RS-485 connection using a protocol such as Modbus. - Data Conversion and Protocol Handling:
The IoT gateway intercepts the raw Modbus data and converts it to protocols suitable for transmission over the Internet (such as MQTT or HTTP). This conversion is crucial to ensure compatibility with cloud-based platforms. - Secure Data Transmission:
Data is then securely transmitted to a cloud platform using encrypted 4G/LTE connections. Encryption (e.g., AES-256) is standard practice to protect data integrity and confidentiality during transit. - Cloud Processing:
Once in the cloud, data undergoes normalization, processing, and storage. Cloud-based services can then run analytics and display the data via intuitive dashboards. - Visualization and Alerting:
The final processed information is made available on user interfaces such as web or mobile dashboards. These dashboards offer real-time data visualization, historical trend analysis, and alert systems to notify users of potential anomalies.
3. Data Flow Table
The table below summarizes the key stages of data flow:
| Stage | Description | Key Protocol/Technology |
|---|---|---|
| Data Collection | Gathering energy parameters from the meter | RS-485/Modbus, Analog-to-Digital Conversion |
| Protocol Conversion | Translating data for Internet transmission | MQTT, HTTP, Modbus RTU |
| Secure Transmission | Encrypting and sending data over the cellular network | 4G/LTE, AES-256 Encryption |
| Cloud Processing | Normalizing, storing, and analyzing received data | Cloud Databases, Real-Time Analytics |
| Visualization and Alerts | Displaying processed data and issuing notifications | Interactive Dashboards, Prebuilt Widgets |
Key Benefits
Implementing remote monitoring solutions with IoT gateways offers substantial benefits that extend from cost savings to enhanced operational efficiency.
1. Enhanced Energy Efficiency
By providing real-time visibility into energy consumption, organizations can detect abnormal usage patterns and inefficiencies immediately. Such timely interventions can lead to significant cost reductions and lower energy waste.
- Real-Time Monitoring:
Enables instant awareness of power fluctuations and unusual consumption. Operators can take corrective measures before a minor glitch escalates. - Data-Driven Decision Making:
Historical trends and analytics help in predicting peak usage periods, enabling better resource utilization and preventive maintenance. - Reduced Operational Costs:
Remote configuration and automated alerts reduce the need for on-site maintenance visits, thereby cutting travel and manpower expenses.
2. Improved Reliability and Safety
IoT-enabled remote monitoring ensures that potential issues are identified promptly, minimizing downtime and avoiding catastrophic failures. The continuous oversight ensures that energy assets are running within safe operational thresholds.
3. Flexibility and Scalability
HashStudioz IoT gateways are designed for scalability. They can easily integrate new devices as the facility grows, and their customizable interfaces ensure that the system can be adapted to various energy meter models and sensor types. This future-proofs the system and prepares it for integration with additional systems such as HVAC controls or renewable energy monitors.
4. Comparative Analysis Table
The table below contrasts traditional energy meter monitoring with advanced remote monitoring using IoT:
| Parameter | Traditional Monitoring | IoT Remote Monitoring |
|---|---|---|
| Data Availability | Manual, periodic, delayed | Real-time, continuous |
| Infrastructure Cost | Higher maintenance and manpower | Lower cost with automated reporting |
| Scalability | Limited by physical constraints | Scalable via cloud integration |
| Alert Mechanisms | Manual error checking | Automated alerts with predictive analytics |
| Customization | Often static and generic | Fully customizable dashboards and reports |
Implementation Guide
This section provides a step-by-step guide to setting up a remote monitoring system for energy meters using a HashStudioz IoT gateway. The instructions are tailored for users with basic technical knowledge and aim to ensure a smooth, plug-and-play installation.
1. Hardware Installation
Step 1: Mounting the Devices
- Energy Meter: Secure the energy meter in a safe, accessible location close to the target equipment. Ensure that the meter’s terminals are correctly connected for voltage and current measurements.
- IoT Gateway: Mount the HashStudioz IoT gateway in proximity to the energy meter to minimize the cable length for RS-485 communication. Ensure the gateway is placed in an environment that meets its operating temperature range.
Step 2: Wiring and Circuit Connection
A basic circuit diagram helps illustrate the necessary connections between the energy meter and the IoT gateway.
Connections Overview:
- Connect the RS-485 A/B terminals of the energy meter to the corresponding ports on the IoT gateway.
- Ensure a stable power connection using a 12V industrial PSU.
- Insert the SIM card into the gateway to facilitate cellular connectivity.
Step 3: Secure Physical Installations
- Use protective enclosures if the devices are installed in harsh or outdoor environments.
- Ensure all wiring conforms to the relevant industrial and electrical standards.
2. Software and Cloud Configuration
Step 1: Gateway Configuration
Access the gateway’s configuration panel via a web browser or the official HashStudioz mobile app. Set key parameters, including polling intervals (typically 15–60 seconds), baud rate, and Modbus register mapping—for example, voltage at register 30001, current at 30007, and power at 30013.
Here’s a sample mapping in pseudo-code:
pythonCopyEditregisters = {
    "voltage": 30001,
    "current": 30007,
    "power": 30013
}
Step 2: Cloud Integration and Dashboard Setup
Log into HashStudioz’s cloud platform, create a new project using the IoT Gateway template, and configure data streams for each key parameter. Assign virtual pins and design your dashboard with interactive widgets—such as gauges, graphs, and tables—for effective real-time monitoring.
Step 3: Security and Encryption Settings
Activate AES-256 encryption on the gateway to protect data transmission, and implement user authentication and authorization protocols to restrict access to critical information.
3. Testing and Verification
After installation and configuration, perform the following tests:
- Connectivity Test: Verify that the gateway successfully transmits data to the cloud.
- Data Accuracy Check: Compare the readings from the energy meter with historical data to ensure accuracy.
- Alert Functionality: Simulate an anomaly (e.g., a sudden spike in energy usage) to test that alerts are triggered immediately.
4. Visualization Implementation
A custom dashboard interface can be implemented using popular platforms like Blynk 2.0 or proprietary cloud solutions from HashStudioz. The sample diagram below illustrates the data visualization process from sensor readings to dashboard alerts:
Troubleshooting and Maintenance
Even with a well-designed remote monitoring system, troubleshooting and regular maintenance are crucial to ensure continuous operation.
1. Common Issues and Solutions
- Connectivity Problems:
Issue: Data loss or intermittent connectivity between the gateway and the cloud.
Solution: Check SIM card signal strength, verify that the gateway firmware is up to date, and inspect physical connections. Regular network tests are recommended. - Data Inaccuracies:
Issue: Readings deviating from expected norms.
Solution: Calibrate the energy meter periodically, check RS-485 cable integrity, and validate the register mapping settings in the gateway configuration. - Dashboard Errors:
Issue: Incorrect data representation or delayed updates on the dashboard.
Solution: Check the data stream configurations and confirm the cloud platform’s processing engine works correctly. Use real-time logging features to diagnose issues.
2. Regular Maintenance Checklist
- Monthly:
- Check all physical connections and ensure devices are securely mounted.
- Review gateway logs for any unusual activity.
- Quarterly:
- Update firmware for both the IoT gateway and any connected devices.
- Test the full data flow from the energy meter to the dashboard.
- Clean any dust and debris from installation areas.
- Annually:
- Calibrate energy meters and review system performance reports.
- Reassess connectivity solutions and update network configurations if necessary.
Real-World Applications and Future Trends
1. Case Studies and Industry Adoption
Remote monitoring solutions are increasingly adopted across various industries:
- Manufacturing Plants:
Precise energy monitoring helps in reducing operational costs by identifying inefficiencies during peak production times. Real-time data allows swift corrective actions, avoiding expensive downtime. - Smart Cities:
City management employs IoT gateways to monitor energy usage across public infrastructure, ensuring effective allocation of resources and supporting sustainability initiatives. - Renewable Energy Farms:
Integrating remote monitoring helps maintain solar panels, wind turbines, and other renewable assets. Continuous data feedback supports preventive maintenance strategies and optimizes energy production.
In each of these applications, the primary benefit is the ability to generate actionable insights from data. Operators not only respond to issues as they arise but also harness historical data to plan future energy strategies effectively.
2. Future Trends in Remote Energy Monitoring
- Advanced Analytics and AI Integration:
With the expansion of IoT devices, advanced analytics and artificial intelligence will play a significant role in predicting energy demand patterns and optimizing resource distribution. Data-driven insights will move from reactive to predictive, further reducing operational costs. - Increased Interoperability:
As more interconnected devices join the network, gateways will evolve to support multiple communication protocols and improved interoperability between legacy systems and new digital technologies. - Enhanced Security Measures:
With heightened awareness around cybersecurity, future systems will incorporate more robust, multi-layered security protocols to protect sensitive energy data across all stages—collection, transmission, and storage. - Energy Asset Management Integration:
Remote monitoring systems will become integral parts of broader energy management systems (EnMS). This integration will enable organizations to optimize not only energy consumption but also the overall asset health and performance.
Conclusion
Remote monitoring of energy meters using HashStudioz IoT gateways offers a transformative solution tailored for modern energy management needs. Through real-time monitoring, secure data transmission, and intuitive visualization, industries can drastically enhance operational efficiency while minimizing costs.