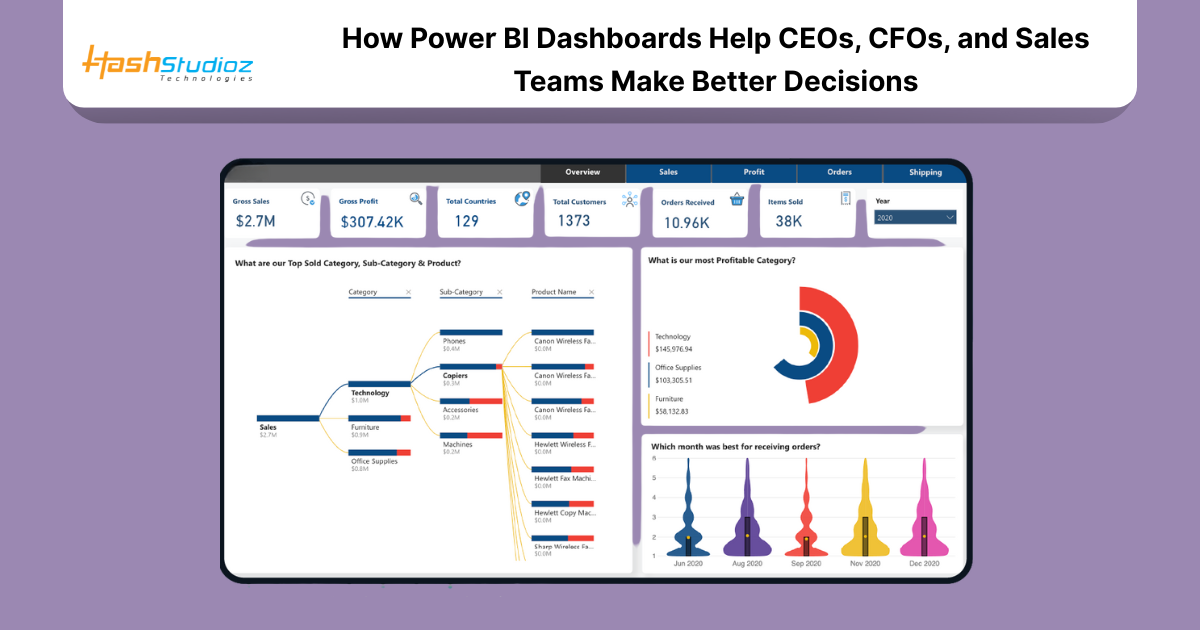
In today’s data-driven business world, decision-makers need accurate and real-time information. CEOs, CFOs, and sales teams handle large amounts of data daily. Turning this data into actionable insights is a priority. Power BI Analytics Services offer tools that convert raw data into visual dashboards. These dashboards allow fast, data-based decisions with high precision.
Table of Contents
What Is Power BI?
Power BI is a business analytics tool developed by Microsoft. It connects to multiple data sources and provides interactive dashboards. The platform supports both cloud and on-premise environments. It is used across industries for financial analysis, sales forecasting, and operational tracking.
According to a 2024 Gartner report, Power BI is one of the top-rated analytics tools in terms of usability and performance.
Why Decision-Makers Need Dashboards
Modern businesses generate data from many platforms—ERP, CRM, social media, and web traffic. Without a proper tool, decision-makers may struggle to get a clear picture. Static reports take time to build and often miss real-time context. Power BI dashboards solve these issues with dynamic visuals and real-time updates.
Benefits for CEOs
1. Real-Time Business Overview
CEOs need a full picture of business health. Power BI dashboards pull data from all departments into one view. Metrics such as revenue, customer growth, and expenses are available in real time.
Example: A CEO of a manufacturing firm can track plant performance, product returns, and market demand from a single dashboard.

2. Faster Decision Making
With Power BI dashboards, data is visual and easy to understand. CEOs can spot trends and risks without going through spreadsheets.
Fact: A Forrester study shows that organizations using Power BI reported a 27% improvement in decision-making speed.
3. Customizable Executive Reports
Power BI allows executives to set KPIs that align with business goals. Dashboards can be personalized for different business units and roles.
Benefits for CFOs
1. Financial Reporting and Budget Tracking
CFOs need detailed views of budgets, cash flow, and expenses. Power BI Analytics provides real-time financial dashboards. It also supports historical data comparisons for forecasting.
Example: A CFO can track budget versus actuals across departments, identify overspending, and adjust strategy quickly.
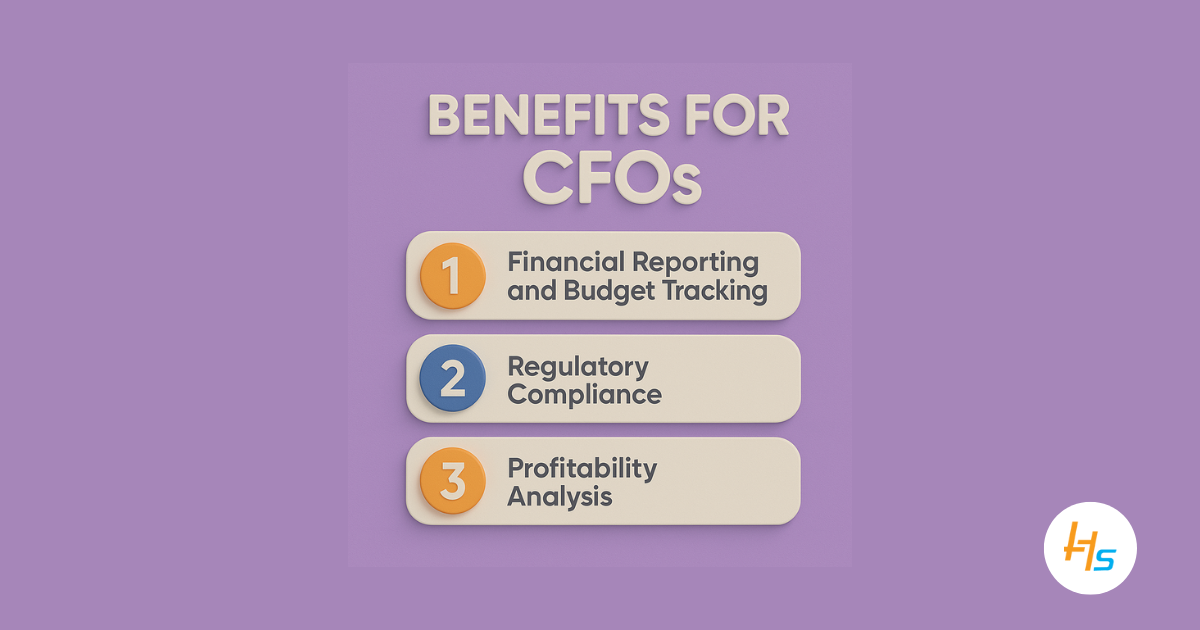
2. Regulatory Compliance
With automated reporting, CFOs can ensure that reports comply with local and international standards. Dashboards also provide audit trails.
Stat: According to Deloitte, companies using BI tools reduce compliance errors by 20%.
3. Profitability Analysis
CFOs can analyze margins by product, region, or customer segment. Power BI helps identify underperforming areas that need attention.
Power BI Analytics Services can also integrate predictive models to assess future revenue based on market data.
Benefits for Sales Teams
1. Sales Performance Tracking
Sales teams must track performance against goals. Power BI dashboards show real-time sales figures, win-loss rates, and pipeline metrics.
Example: A sales manager can compare daily targets with actual numbers and adjust team focus immediately.
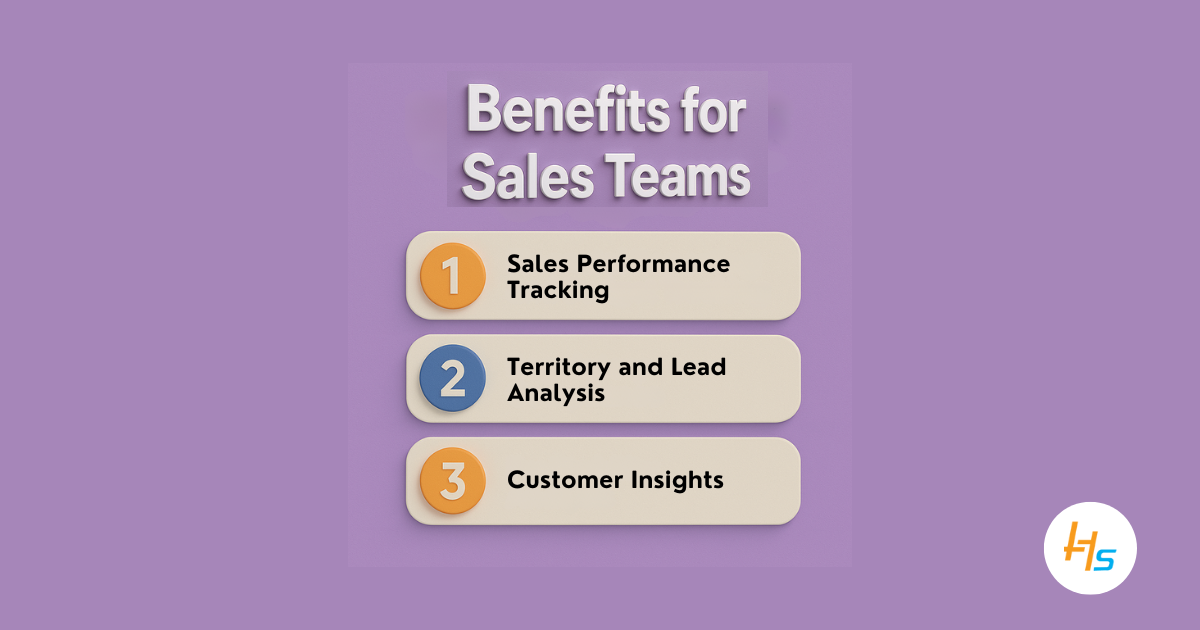
2. Territory and Lead Analysis
Power BI helps segment sales data by region, product, and lead source. This helps identify which areas bring the best returns.
Fact: Sales teams using Power BI reported a 32% increase in sales efficiency, based on Microsoft’s internal research.
3. Customer Insights
Understanding customer behavior is key. Power BI integrates with CRM systems like Dynamics 365 or Salesforce. It helps visualize buying patterns, customer satisfaction scores, and churn rates.
Key Features of Power BI Analytics
a. Data Integration
Power BI connects with Excel, SQL, Google Analytics, SAP, and over 120 other sources. This ensures a complete picture without data loss.
b. Interactive Dashboards
Dashboards are interactive. Users can click on graphs to filter data by region, time, or department.
c. Real-Time Alerts
Users can set thresholds for KPIs. Power BI sends alerts when a value crosses a set limit.
d. Mobile Access
Power BI dashboards are available on mobile devices. This allows decision-makers to access insights on the go.
e. Security and Role-Based Access
Each user sees only the data relevant to their role. This ensures data security and privacy.
Examples of Power BI Analytics Services in Action
1. Retail Sector
A retail chain used Power BI to track sales across 200 stores. Dashboards helped identify which products sold well in each region. As a result, they increased overall sales by 18% within 3 months.
2. Healthcare
A hospital chain used Power BI to monitor patient admissions and discharge times. The dashboard helped reduce patient wait time by 22%.
3. Finance
A financial firm implemented Power BI to manage portfolio risk. Real-time tracking helped avoid losses during market fluctuations.
Common Metrics Tracked
1. For CEOs
- Revenue Growth: Power BI dashboards display real-time revenue trends, helping leaders identify patterns, track targets, and make informed financial decisions quickly.
- Employee Headcount: Dashboards show current employee numbers, hiring trends, and departmental distribution, assisting HR and executives with workforce planning and resource allocation.
- Customer Satisfaction: Customer feedback data is visualized to track satisfaction scores, response times, and service quality, supporting better customer experience decisions.
- Business Expansion Progress: Power BI tracks expansion milestones, regional performance, and investment outcomes, giving leadership clear visibility into business growth and development progress.
2. For CFOs
- Operating Expenses: Power BI dashboards break down operating expenses by category, enabling finance teams to monitor costs and control spending more effectively.
- Profit Margins: Profit margin trends are tracked across products or regions, helping CFOs identify high-performing areas and address underperforming segments promptly.
- Debt to Equity Ratio: Dashboards calculate debt to equity in real time, helping executives evaluate financial stability and maintain balanced capital structures for growth.
- Cost Forecasting: Power BI uses historical and current data to forecast future costs, supporting better budget planning and minimizing financial surprises.
3. For Sales Teams
- Sales Volume: Power BI tracks total units or services sold over time, allowing sales leaders to assess demand trends and adjust targets accordingly.
- Conversion Rate: Dashboards show lead-to-customer conversion rates, helping teams measure campaign effectiveness and optimize strategies for improved performance.
- Average Deal Size: Real-time visuals display average deal values across reps or regions, supporting pricing strategy adjustments and revenue planning decisions.
- Customer Acquisition Cost: Power BI calculates acquisition costs by dividing marketing spend by new customers, helping evaluate efficiency and refine budget allocations.
Technical Implementation Considerations
1. Data Preparation
Clean data is vital. Organizations must ensure that all systems feed reliable data into Power BI.
2. User Training
Teams need training to use dashboards effectively. Power BI has a low learning curve but offers deep functionality.
3. Integration with Existing Systems
Power BI can integrate with ERP, CRM, and HR systems. Businesses must ensure seamless connections.
4. Custom Development
Using Power BI Analytics Services, companies can build custom dashboards. This ensures the reports match their unique requirements.
The Role of Power BI Analytics Services
Power BI Analytics Services offer expert help in planning, building, and maintaining dashboards. They ensure:
1. Accurate Data Modeling
Power BI ensures accurate data modeling by using structured schemas and DAX, allowing reliable calculations and consistent reporting across departments.
2. Fast Deployment
Dashboards can be deployed quickly using Power BI templates, connectors, and services, reducing setup time and accelerating business insight delivery.
3. Scalable Architecture
Power BI supports scalable architecture with cloud-based services, allowing organizations to handle growing data volumes and user demands efficiently.
4. Ongoing Maintenance and Upgrades
Regular updates and support ensure dashboards remain functional, accurate, and aligned with evolving business requirements and data sources.
5. Compliance with Data Governance Standards
Power BI enforces data governance through access controls, row-level security, audit logs, and integration with compliance frameworks for enterprise use.
Ready to Turn Data Into Action?
At HashStudioz, we don’t just build dashboards—we build clarity, speed, and smarter decisions.
With our Power BI Analytics Services, your raw business data transforms into real-time, interactive insights that put you in control.
- Make faster, more confident decisions
- Track performance across every department
- Uncover trends and opportunities before your competitors do
Don’t let valuable data sit idle.
Book your FREE Power BI consultation with HashStudioz today and discover how powerful your business decisions can become.

Conclusion
Power BI dashboards offer vital support for CEOs, CFOs, and sales teams. These tools improve clarity, reduce response time, and enhance overall decision quality. Real-time insights, predictive analytics, and powerful visuals make Power BI a top choice for businesses today.By working with professional Power BI Analytics Services, organizations can make the most of their data. From sales tracking to financial forecasting, Power BI helps decision-makers act with confidence and precision.