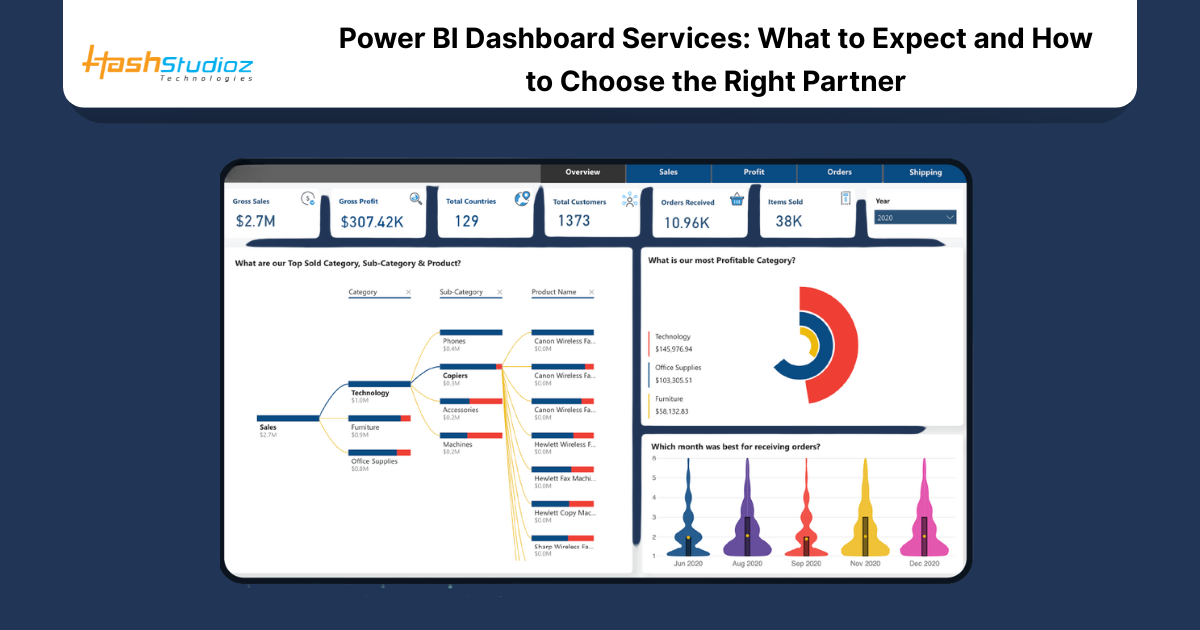
Data visualization tools are critical in modern business intelligence. Microsoft’s Power BI leads the market due to its ability to create interactive dashboards and real-time reports. Companies use Power BI Analytics Services to understand data, make better decisions, and track key performance indicators (KPIs) across departments.
Table of Contents
What Are Power BI Dashboard Services?
Power BI Dashboard Services help businesses create, manage, and optimize dashboards using Microsoft Power BI. These services include:
- Dashboard design and customization
Dashboard design and customization involve selecting visuals, organizing layouts, and applying filters that match business needs. A well-structured dashboard provides quick access to key metrics and improves decision-making. - Data modeling and integration
Data modeling and integration connect different data sources and define relationships among datasets. This step ensures consistent, accurate reporting and enables meaningful analysis across various departments and systems. - Performance tuning
Performance tuning optimizes dashboard speed by reducing complex calculations, limiting visuals, and managing data load. It ensures fast access to insights, especially when handling large or real-time datasets. - Real-time data updates
Real-time data updates allow dashboards to reflect current data from live sources. This feature supports instant decision-making in sales, operations, and finance by displaying up-to-the-minute information.
These services are provided by companies or consultants with expertise in Power BI Analytics. They ensure the dashboards are useful, responsive, and tailored to the business.
Importance of Power BI Dashboards in Business Intelligence
Power BI dashboards provide a visual summary of business data. They bring all the critical metrics into a single view, allowing faster decision-making.
Key benefits include:
- Real-time monitoring: Dashboards show updated data, which is crucial for tracking sales, inventory, or production.
- Improved collaboration: Teams can share dashboards across departments.
- Data accuracy: Dashboards reduce the risk of manual reporting errors.
- Better decision-making: Visuals and filters help leaders see trends and patterns.
According to a report by Gartner, over 40% of data and analytics projects fail due to poor visualization practices. Choosing the right Power BI Dashboard Service can help overcome this issue.
Core Features of Power BI Dashboards
1. Interactive Reports
Power BI dashboards include filters, slicers, and drill-down features. These allow users to interact with the data and view specific segments without editing the source.
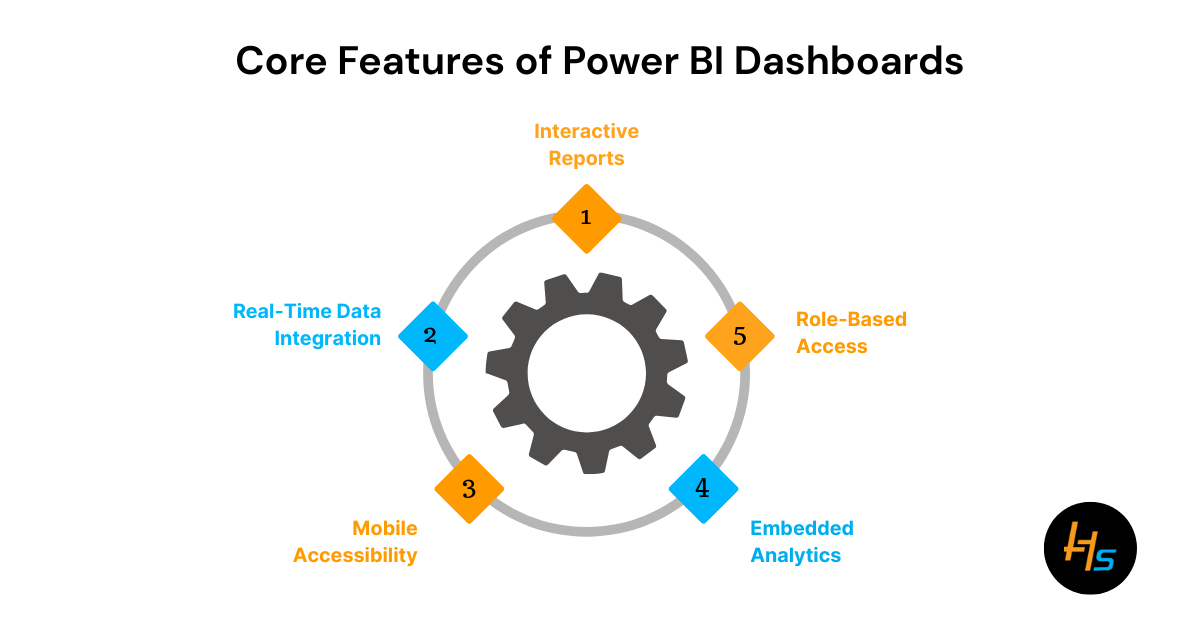
2. Real-Time Data Integration
Power BI can connect to various data sources such as:
- Excel sheets
Excel sheets are widely used for storing structured business data. Power BI connects to Excel files to import tables, pivot charts, and formulas, allowing fast visualization and basic reporting. - SQL databases
Power BI integrates with SQL databases to access large volumes of transactional or historical data. It supports direct queries or imports for building robust, scalable, and real-time reporting solutions. - Azure services
Azure services, like Azure SQL Database and Azure Data Lake, offer cloud-based storage and processing. Power BI seamlessly connects to these services for secure, real-time analytics and enterprise-level data handling. - APIs from ERP or CRM systems
Power BI can connect to APIs from ERP or CRM systems like SAP or Salesforce. This integration helps pull live business data, enabling users to track operations, sales, and customer behavior.
3. Role-Based Access
Access can be limited based on user roles. For example, a regional manager may see data relevant only to their location.
4. Mobile Accessibility
Power BI dashboards are responsive and mobile-friendly. Users can access insights from phones or tablets.
5. Embedded Analytics
Companies can embed dashboards into their applications or websites. This improves user experience and provides instant access to insights.
What to Expect from a Power BI Analytics Services Provider
A reliable service provider offers more than just dashboard setup. They guide clients through every step of the process. Below are the key areas where their support is important.
1. Requirement Analysis
The provider starts by understanding the business needs, objectives, and existing data infrastructure.
Example: A retail company may want dashboards for sales, inventory, and customer feedback. The provider identifies which metrics to show and from which data sources.
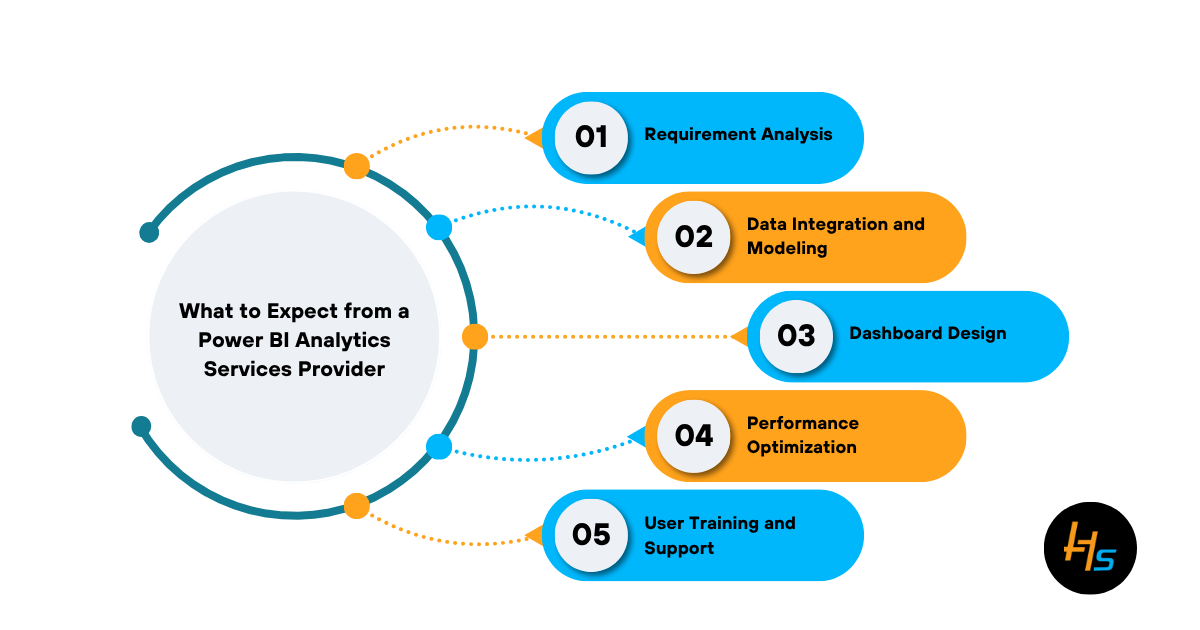
2. Data Integration and Modeling
Raw data is usually scattered. The provider connects different sources and builds a logical data model.
Tasks include:
- Cleaning and preparing data
Cleaning and preparing data involves removing errors, handling missing values, and standardizing formats. This step ensures accuracy and consistency, making the data ready for meaningful analysis and visualization in Power BI. - Creating relationships between datasets
Creating relationships between datasets links tables using common fields, like customer IDs or product codes. These connections enable cross-table analysis and support accurate filtering, aggregation, and reporting within dashboards. - Defining KPIs and calculated fields
Defining KPIs and calculated fields helps measure business performance. Power BI uses DAX formulas to create metrics such as profit margins, conversion rates, or growth percentages tailored to specific objectives.
3. Dashboard Design
The design phase involves selecting visuals, setting filters, and organizing the layout.
Good design practices include:
- Using consistent colors and fonts
Using consistent colors and fonts improves readability and ensures a professional look. It helps users quickly recognize categories, understand visual patterns, and maintain focus across all dashboard pages. - Limiting the number of visuals per page
Limiting the number of visuals per page avoids clutter and enhances performance. A clean layout directs attention to the most important insights and makes dashboards easier to read and navigate. - Highlighting key figures
Highlighting key figures with bold text, color contrast, or larger fonts draws user attention to critical metrics. This practice ensures decision-makers instantly see performance results without extra effort.
4. Performance Optimization
Slow dashboards affect user experience. A service provider ensures fast loading by:
- Reducing unnecessary visuals
Reducing unnecessary visuals improves dashboard speed and user experience. Extra charts or graphics can slow down performance and distract from core insights, so only essential visuals should be displayed. - Using summarized tables
Using summarized tables instead of detailed data reduces load time and enhances clarity. Aggregated data provides faster performance while still delivering the insights needed for decision-making and trend analysis. - Avoiding complex measures in visuals
Avoiding complex measures in visuals helps maintain quick load times. Heavy DAX calculations can delay rendering, so it’s better to pre-calculate values or use simpler expressions when possible.
5. User Training and Support
End-users may not be familiar with Power BI. The provider should train users on:
- Navigating dashboards
Navigating dashboards involves understanding layout, tabs, and visuals. Users learn to explore different pages, interact with charts, and locate key metrics quickly, making the dashboard experience more efficient and user-friendly. - Applying filters
Applying filters allows users to view specific data segments. They can filter by date, region, product, or department, helping them analyze targeted insights without modifying the underlying dataset or report. - Exporting reports
Exporting reports enables users to share insights in PDF, PowerPoint, or Excel formats. This feature supports offline review, email distribution, and presentation of key findings during meetings or reports.
Ongoing support ensures the dashboards remain functional and relevant.
How to Choose the Right Power BI Dashboard Partner
Choosing the right service provider is key. The wrong partner can waste time and resources. Here’s a step-by-step approach to selecting the right one.
1. Check Experience and Certifications
Look for companies with certified Power BI professionals. Microsoft provides certifications like:
- PL-300: Power BI Data Analyst Associate
- DA-100 (now retired): Previously focused on Power BI analytics
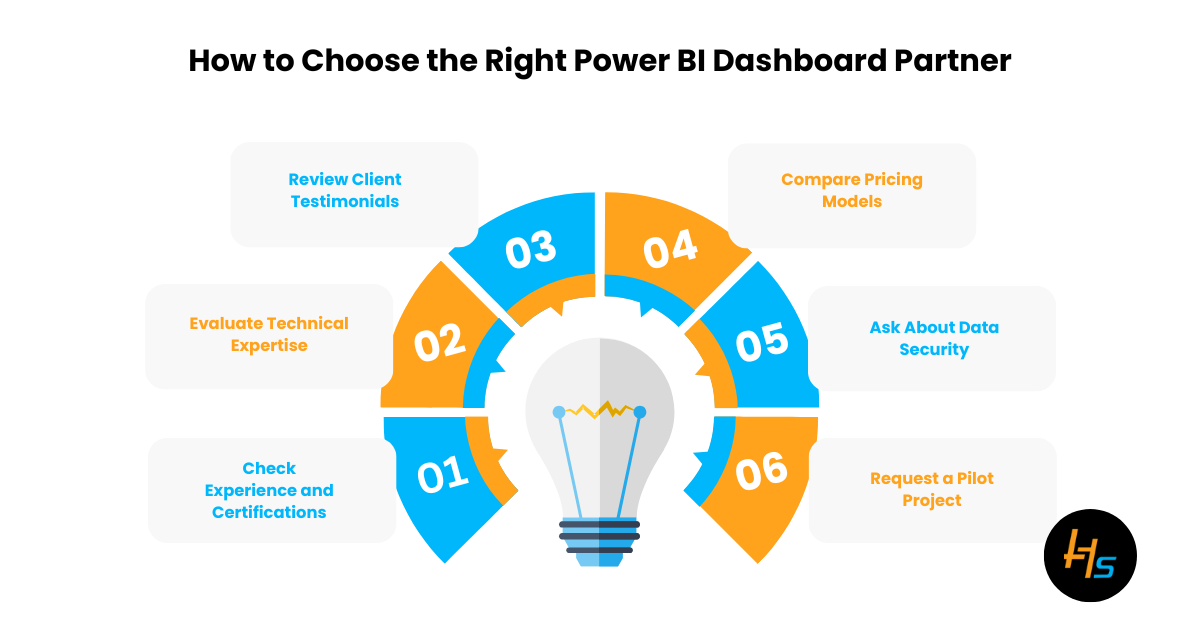
2. Evaluate Technical Expertise
The provider must have a solid understanding of:
- DAX (Data Analysis Expressions): DAX is a formula language in Power BI used to create custom calculations and measures. It enables users to build advanced metrics like running totals, ratios, and time-based comparisons.
- Power Query: Power Query is a data transformation tool in Power BI. It helps users clean, filter, merge, and shape data before loading it into the model, ensuring accurate and organized input.
- SQL: SQL is essential for querying relational databases. Power BI professionals use SQL to extract, join, and summarize data from SQL Server, MySQL, or other database systems before importing into reports.
- Cloud platforms like Azure or AWS: Cloud platforms like Azure or AWS host data in scalable environments. Power BI connects to these platforms to access real-time data, support large datasets, and ensure secure and reliable analytics.
3. Review Client Testimonials
Check reviews on Clutch, G2, or LinkedIn. Contact their past clients for feedback.
Questions to ask:
- Were the dashboards delivered on time?
Timely delivery shows the provider’s ability to manage deadlines and project scope. On-time dashboards reflect strong planning, reducing delays in analysis and ensuring the business gets insights when needed. - Was the team responsive?
A responsive team addresses questions, feedback, and issues quickly. Regular communication ensures smooth progress, minimizes confusion, and builds trust between the business and the Power BI service provider. - Did the dashboards help solve business problems?
Effective dashboards should answer key business questions. Whether tracking sales, reducing costs, or improving efficiency, dashboards must provide clear insights that support real decisions and measurable business improvements.
4. Compare Pricing Models
Power BI Analytics Services can be offered under:
- Hourly rate: Hourly rate pricing charges based on time spent. It suits small tasks or consulting work, offering flexibility for short-term needs, custom fixes, or when project scope is uncertain or evolving.
- Project-based cost: Project-based cost offers a fixed price for a defined scope. It works well for full dashboard development projects with clear goals, timelines, and deliverables agreed upon before work begins.
- Ongoing support contract: Ongoing support contracts cover continuous help, updates, and maintenance. Ideal for businesses needing regular dashboard revisions, user training, or monitoring to keep Power BI systems optimized and problem-free over time.
5. Ask About Data Security
Your business data is sensitive. The provider should follow strict security practices:
- Role-based access controls: Role-based access controls limit data visibility based on user roles. This ensures that only authorized individuals can view or edit specific reports, protecting sensitive information within teams and departments.
- Encrypted data transfers: Encrypted data transfers protect data as it moves between sources and Power BI. Encryption prevents unauthorized access, keeping business information secure during integration, sharing, or report publishing processes.
- Compliance with GDPR or industry regulations: Compliance with GDPR or industry regulations ensures proper handling of personal or sensitive data. Power BI service providers must follow data privacy rules to avoid legal issues and maintain trust.
6. Request a Pilot Project
Many vendors offer a small paid trial. Use this to evaluate:
- Communication: Clear communication is key during a pilot project. Regular updates, quick responses, and detailed explanations help ensure both the provider and client stay aligned throughout the dashboard development process.
- Dashboard quality: Dashboard quality reflects how well the visuals, layout, and data accuracy meet business needs. A well-designed dashboard should be easy to use, visually clear, and deliver actionable insights effectively.
- Response time to change: Quick response to change shows how adaptable the provider is. Timely updates or fixes during the pilot phase indicate their ability to handle feedback and adjust solutions as requirements evolve.
Example Use Cases of Power BI Analytics
1. Healthcare Sector
A hospital chain used Power BI Analytics to track patient admissions, staff availability, and medicine stock. The dashboards reduced stock-outs by 35% in 6 months.
2. Manufacturing
A factory used Power BI dashboards to track machine uptime and defect rates. This helped reduce production downtime by 18% in a quarter.
3. E-commerce
An online retailer integrated Power BI with their order management system. Real-time dashboards helped identify sales trends and low-performing SKUs.
Power BI vs Other BI Tools
While there are many BI tools like Tableau, QlikView, and Looker, Power BI has several advantages:
| Feature | Power BI | Tableau | Qlik |
| Cost | Lower | High | Medium |
| Integration with Microsoft Stack | Strong | Limited | Moderate |
| User Interface | Easy | Complex | Moderate |
| Learning Curve | Low | Medium | Medium |
Power BI’s strong integration with Office 365 and Azure makes it a top choice for businesses using Microsoft tools.
Future Trends in Power BI Analytics
1. AI-Powered Insights:
Power BI now includes AI features like natural language queries and anomaly detection. This helps users find insights without writing code.
2. Data Governance:
More companies want audit logs, sensitivity labels, and access reports. Power BI is adding features to support enterprise-level data governance.
3.Data Sharing Across Tenants:
Businesses with multiple subsidiaries can now share dashboards across Power BI tenants securely.
Why Choose HashStudioz for Power BI Dashboard Services?
At HashStudioz, we offer full-scale Power BI Analytics Services tailored to your business needs. Our certified experts design, build, and maintain dashboards that deliver measurable business value.
Why Clients Choose Us:
- Microsoft-certified Power BI professionals
- Expertise in DAX, Power Query, SQL, and Azure
- Proven success across healthcare, retail, and manufacturing
- Secure data handling and compliance assurance
- Scalable solutions for startups to enterprises
Ready to transform your data into insights?
Contact HashStudioz today to book a consultation or request a custom demo!

Conclusion
Power BI Dashboard Services provide companies with a structured way to make sense of their data. These services include setup, integration, optimization, and ongoing support. Choosing the right Power BI Analytics Services provider requires checking experience, expertise, security standards, and client feedback.
In today’s data-driven world, good dashboards are not just helpful—they are essential. With the right partner, Power BI Analytics can improve decision-making, reduce costs, and drive growth across your organization.