


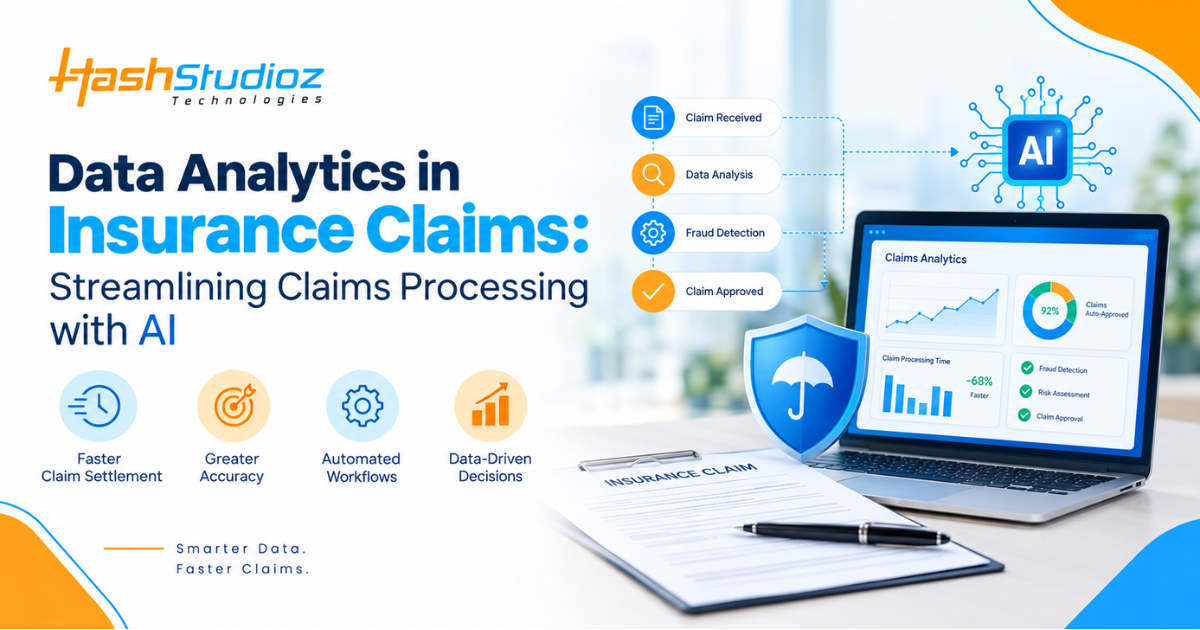
Insurance fraud costs the U.S. economy an estimated $308.6 billion a year. That figure comes from the Coalition Against Insurance Fraud. The National Insurance Crime Bureau puts fraud-tainted claims at roughly 10% of all property and casualty submissions. McKinsey’s 2025 analysis of AI adoption across insurance found something striking: full AI deployment jumped to 34% of carriers, up from just 8% the year before. It’s one of the fastest technology adoption curves the sector has seen. Industry benchmarking published in 2026 shows straight-through processing rates climbing too, from a 7% baseline to 70-90% at carriers running mature, AI-driven claims automation.
Those numbers describe the same shift from different angles. Claims processing has become a data problem before it’s an operations problem. Carriers that treat claims data as a byproduct, something to store and report on after the fact, are losing ground. Their competitors treat it as the engine that runs the process instead. This article breaks down how that engine actually works. It covers what it takes to build one, and where the effort tends to fail.
Table of Contents
Why Claims Processing Became Insurance’s Biggest Cost Center
Claims handling typically eats 60-70% of an insurer’s total operating expense. That’s more than underwriting, distribution, and policy administration combined. A single property and casualty claim moves through several stages: first notice of loss, coverage verification, document intake, liability assessment, reserve setting, vendor coordination, and payment authorization. Each handoff introduces a delay. Most carriers still run these handoffs across four to seven disconnected systems, often from different vendors with no shared data layer.
The result is a straight-through processing rate that sits around 7% at a typical unautomated carrier. Nearly every claim requires a human to manually reconcile information. That information already exists somewhere in the organization, just not in a form the next system can read. Industry research from Aclaimant and others puts manual document handling at up to 80% of total time spent on a non-automated claim. The work isn’t complex. The data simply isn’t structured for machine consumption.
This is the gap analytics closes. It isn’t about replacing adjusters with algorithms. It’s about giving the claims pipeline a shared, structured, queryable view of information that used to live in PDFs, call transcripts, and adjuster notes.
What Data Analytics Actually Changes Inside the Claims Lifecycle
A modern claims analytics stack touches four distinct stages. Each one solves a different operational problem.
At first notice of loss, natural language processing and optical character recognition extract structured fields from intake forms, emails, and photos in real time. This replaces routing everything to a queue for manual entry. Claims get classified and routed to the right adjuster or automation path within minutes of submission, not after a batch review the next day.
During assessment, predictive models estimate claim severity and likely payout before the file is fully documented. This lets carriers set more accurate reserves earlier. That matters because under-reserved claims distort financial reporting, and over-reserved ones tie up capital that could be deployed elsewhere. Health insurers use similar models to flag claims with a high probability of recurring treatment. Case management can then step in proactively instead of reactively.
For fraud and anomaly detection, machine learning models compare incoming submissions against historical patterns. They look at unusual claimant behavior and network relationships between claimants, providers, and repair shops. A single adjuster working one file at a time would never catch these connections.
At settlement, analytics-driven decision engines handle simple, low-risk claims end to end with no human review required. Complex or high-value claims get routed to specialists instead. Each arrives with a pre-built summary of relevant history, documentation, and risk flags already attached.
The Data Foundation Problem Nobody Talks About Enough
Most articles on this topic jump straight to fraud detection and skip the part that actually determines whether any of it works data quality and integration.
Claims data comes in two forms. Structured data includes things like claimant age, policy number, loss date, and claim amount. It sits neatly in spreadsheets and relational databases and has always been easy to analyze. Unstructured data includes adjuster notes, medical records, repair estimates, photos, and recorded calls. Historically, this required a human to read and interpret it. Milliman’s research on claims analytics notes a common problem here: even when this data technically exists in the system, inconsistent coding and missing fields make it hard to extract reliable insight.
Modern AI models changed the economics of unstructured data. This is especially true for large language models fine-tuned on insurance-specific vocabulary. A model can now read an adjuster’s free-text notes and extract loss cause, injury type, and liability indicators with real consistency. But this only works if the underlying data pipeline supports it. That means consistent schemas, clean ingestion from every source system, and a warehouse or lakehouse architecture that can serve both batch reporting and real-time scoring.
Carriers that skip this step and buy an AI fraud tool without fixing their data pipeline typically see disappointing results within six months. The model isn’t wrong; the data feeding it is inconsistent. This is the single most common reason claims analytics initiatives stall after a promising pilot.
Fraud Detection: Where Analytics Pays for Itself Fastest
Fraud detection remains the fastest path to measurable ROI because the financial exposure is so large and so well documented. SAS research puts the math simply a 1% improvement in loss ratio for a $1 billion insurer is worth more than $7 million to the bottom line, and fraud reduction is one of the most direct levers for improving loss ratio.
Traditional fraud detection relied on static business rules. A claim got flagged if it exceeded a dollar threshold or matched a known bad actor’s information. These rules catch obvious fraud but miss anything novel. They also generate enough false positives that investigators end up chasing legitimate claims while sophisticated fraud slips through. Machine learning models instead learn behavioral patterns from historical outcomes. They look at unusual timing between policy purchase and claim filing, claimant networks tied to flagged providers, or document metadata inconsistencies that suggest synthetic evidence.
That last point matters more each year. AI-generated fraud documentation, forged repair estimates and manipulated damage photos, now passes traditional verification checks at high rates because the underlying generative tools produce clean metadata and internally consistent text. Detecting it requires analytics models built specifically to catch AI-generated content, not just historical fraud patterns. Carriers that have tightened controls with modern detection have cut mean fraud detection time from roughly 14 days down to 3, according to industry benchmarking research, which matters because the earlier fraud is caught, the smaller the eventual payout exposure.
A Real Example: How Aviva Rebuilt Its Claims Operation Around Data
UK insurer Aviva offers one of the more transparent, publicly documented cases of what a mature claims analytics program looks like in practice. The carrier deployed more than 80 AI models across its claims domain, covering intake triage, liability assessment, and case routing.
The measurable results, reported by Aviva and covered in independent industry analysis, include a 23-day reduction in liability assessment time, a 30% improvement in case routing accuracy, and a 65% drop in customer complaints tied to claims handling. Aviva reported overall savings exceeding £60 million from the broader AI program, with claims-specific initiatives representing a meaningful share of that figure.
What makes this case instructive isn’t the model count. It’s the sequencing. Aviva didn’t buy one large fraud detection platform and expect transformation. It built out data infrastructure and model governance incrementally, starting with the highest-friction, highest-volume claim types (which had the clearest data and the fastest payback) before expanding into more complex liability and injury claims where the data required more preparation.
Predictive Analytics and the Reserve Accuracy Problem
Reserve accuracy is a quieter but equally significant analytics use case. Reserves represent the money an insurer sets aside to cover expected future payouts on open claims, and getting this number wrong in either direction creates real financial cost. Under-reserving understates liabilities and can trigger regulatory scrutiny. Over-reserving ties up capital that should be earning returns elsewhere.
Predictive models trained on historical claims outcomes, incorporating variables like injury severity, treatment duration, jurisdiction, and even external factors like regional medical cost inflation or weather-related repair cost trends, produce reserve estimates that update dynamically as new claim information arrives, instead of a static figure set once at intake and rarely revisited. McKinsey’s research on AI-driven claims and reserve modeling points to a 25-30% reduction in loss adjustment expense for carriers that implement this well, largely because fewer claims require the manual reserve reviews and disputes that consume adjuster time under legacy processes.
Incorporating external data adds another layer of accuracy. Economic indicators, regulatory changes, and regional risk trends all affect claim patterns in ways that internal historical data alone can’t capture. A workers’ compensation reserve model that ignores regional healthcare cost trends will systematically misprice claims in high-inflation markets, for example.
Where Salesforce Fits Into the Claims Data Layer
For carriers running Salesforce Financial Services Cloud or Health Cloud, claims data spreads across several disconnected systems: the CRM, the core claims management platform, document repositories, and often a separate analytics environment entirely. Revenue operations and Salesforce leaders inside insurance organizations frequently end up reconciling these sources by hand, and by the time they publish a report, the numbers have already gone stale because nothing synchronized the underlying data in real time.
Bringing claims analytics into the Salesforce data model fixes this. Custom objects and Financial Services Cloud’s claims data model can hold structured claim status, reserve estimates, and fraud risk scores alongside the customer relationship data that sales, service, and retention teams already use. This means an account manager can see that a policyholder has an open claim with an elevated risk score without switching systems, and a claims dashboard can pull policy tenure and lifetime value data without anyone running a manual export. Getting this integration right typically takes custom data pipeline work between the analytics environment and Salesforce, plus a governance policy that spells out which internal roles can see which claims data, since not every team needs visibility into fraud scoring details.
Building the Analytics Stack: What CTOs and CIOs Need to Get Right
A claims analytics program that survives past the pilot stage depends on decisions made well before any model gets deployed.
Data architecture comes first. A cloud data warehouse or lakehouse that can ingest structured and unstructured data from every claims-adjacent system, policy administration, document management, third-party vendor feeds, needs to exist before model training can produce reliable results. Retrofitting this after a model is already in production is expensive and slow.
Model governance matters just as much, particularly in regulated lines like health and workers’ compensation, where an insurer needs to explain why a model flagged a claim or denied a payout. Explainability isn’t optional in most U.S. states; regulators increasingly require carriers to document how automated claims decisions are made.
Integration with legacy core systems is often the hardest technical piece. Roughly 74% of insurers were still operating on legacy core systems as of 2025, and connecting a modern analytics pipeline to a policy administration system built decades ago requires either custom API development or middleware that most off-the-shelf analytics tools don’t include out of the box.
Change management inside claims operations is the piece most technical teams underestimate. Adjusters who’ve built careers on manual judgment need to trust the model’s recommendations enough to act on them, which requires transparent scoring, not a black-box output that tells an adjuster what to do without explaining why.
Common Pitfalls That Stall Claims Analytics Programs
Several recurring mistakes explain why so many claims analytics initiatives never scale past a pilot.
Carriers frequently buy a point solution, usually a fraud detection tool, without first fixing the underlying data pipeline, which means the model gets fed inconsistent or incomplete data and underperforms regardless of how sophisticated its algorithm is. Others treat analytics as a one-time IT project rather than an ongoing discipline, deploying a model and never retraining it as claims patterns shift, which causes accuracy to degrade within a year or two as fraud tactics and claim behaviors evolve. A third common failure is skipping the change management work with claims staff, resulting in adjusters who route around the new system rather than adopting it, because nobody explained how the model’s recommendations should factor into their existing judgment.
Measuring ROI: What Actually Moves the Needle
Carriers evaluating a claims analytics investment should track a small set of metrics, not a broad dashboard of vanity numbers.
Claims cycle time, measured from first notice of loss to final settlement, is the clearest operational indicator. It’s also the one most directly tied to customer satisfaction. Loss ratio improvement translates most directly into the SAS math above. Even a fractional improvement produces significant bottom-line impact at scale. Straight-through processing rate shows how much claims volume moves without any human touch. It’s the single best proxy for how much labor cost the program is actually removing. Fraud detection rate and false positive rate together tell a fuller story. They show whether the fraud model catches real fraud without burying investigators in false alarms. Adjuster productivity, measured as claims handled per adjuster per month, reveals something else entirely: whether the analytics layer frees up human capacity for complex cases, or just adds another tool adjusters have to manage.
How HashStudioz Approaches Data Analytics for Insurance Claims
HashStudioz builds the data infrastructure and analytics layer that sits underneath these claims transformation efforts. This spans data pipeline architecture, warehouse design, predictive model development, and Salesforce Financial Services Cloud integration. For carriers dealing with fragmented claims data across legacy core systems, document repositories, and CRM platforms, the Data Analytics Services team focuses on the foundational work most vendors skip. That includes clean data ingestion, governance frameworks that satisfy regulatory explainability requirements, and integration between analytics environments and the systems adjusters and Salesforce users actually work in day to day. That foundation determines whether a fraud model or reserve prediction tool performs in production the way it did in the pilot.
Final Thoughts
The carriers seeing measurable results from claims analytics aren’t the ones with the most sophisticated models. They’re the ones that fixed their data foundation first: clean pipelines, consistent schemas, and integration across every system that touches a claim from intake to settlement. Aviva’s results didn’t come from a single fraud detection purchase. They came from sequencing infrastructure work ahead of model deployment, and building trust with claims staff along the way.
For CTOs and CIOs evaluating where to start, the fraud detection and reserve modeling use cases documented here offer the fastest, most measurable payback. But the underlying data architecture work has to happen regardless of which use case comes first. Every downstream model depends on it.

FAQs
1. How much can data analytics reduce insurance claims processing time?
Industry benchmarks from McKinsey and other research put the reduction at 60-75%, with average cycle times dropping from roughly 30 days to under 8 days for carriers with mature AI-driven claims analytics deployments. The exact figure depends heavily on claim complexity and how clean the underlying data pipeline is.
2. What’s the difference between claims automation and claims analytics?
Claims automation refers to executing predefined workflow steps without human intervention, like auto-approving a low-value claim that meets certain criteria. Claims analytics is the broader discipline of using historical and real-time data to generate insights, predictions, and risk scores that inform decisions, whether those decisions are made by a human or an automated system.
3. Do smaller insurers need the same data infrastructure as large carriers?
The scale differs, but the fundamentals don’t. A regional carrier processing thousands of claims a year still needs clean, structured data and a governance framework, just built at a smaller scale and often with more reliance on cloud-managed infrastructure rather than custom-built systems, which keeps upfront investment lower.
4. How does AI-driven fraud detection avoid flagging legitimate claims?
Modern models are trained on labeled historical data that includes both fraudulent and confirmed-legitimate claims, which lets them learn nuanced behavioral patterns rather than relying on rigid dollar-threshold rules. Carriers typically tune these models over several months, adjusting sensitivity based on investigator feedback to reduce false positive rates without missing genuine fraud.
5. Is claims data analytics compliant with insurance regulations like NAIC model laws?
It can be, but compliance depends on how the models are built and documented. Most U.S. states increasingly require explainability for automated claims decisions, meaning carriers need governance frameworks that can show why a model produced a given risk score or recommendation, not just that it did.